home features meters download purchase support ProCenter

Features

FreeMeter - Has the features that most people need and is FREE.

FreeMeter Professional - Has all the features of FreeMeter plus features intended for power users and system administrators.

the meters - For more detailed information on the various meters, visit the meters page.

 MISCELLANEOUS
 
FreeMeter FreeMeter
Professional
 
Operating Systems - Runs on Windows 7, 10, 11 and Windows Server 2008R2 and later. Supports both 32-bit and 64-bit operating systems. Works with all language versions.
32/64-bit - FreeMeter and FreeMeter Professional are available in 32-bit and 64-bit. The installer includes both.
Free Updates - Free updates that include bug fixes and some new features. Major upgrades (such as v3.0) may have an upgrade fee associated with them.
Ads or Spyware - Never.
FREE $9.99
more info
Cost - Single user license.
 
 METERS
 
FreeMeter FreeMeter
Professional
 
Uptime/Runtime - The Uptime/Runtime meter can display three things: (1) the amount of time the system has been running; (2) the amount of time that FreeMeter has been running; (3) the amount of time the system has been in a sleep state.  more info
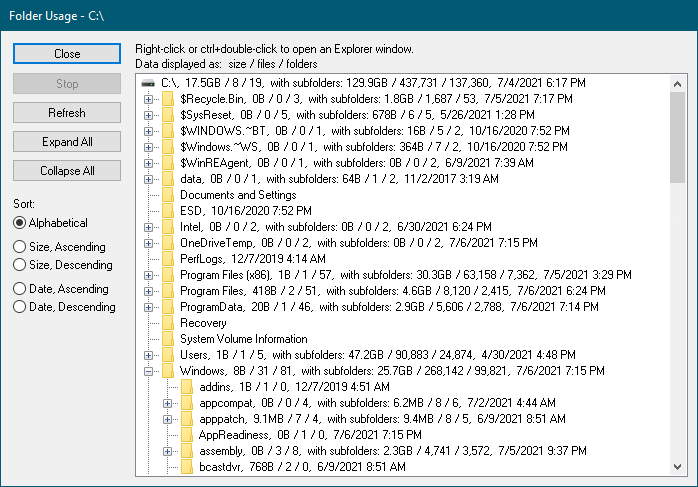
Volume Space - Monitor the disk space usage of local disks and server volumes.  more info
CPU Usage - Find out how busy your processor really is.  more info
CPU Core Usage - Shows the utilization of each CPU core.  more info
User/Kernel CPU Use - CPU Usage and CPU Core Usage graphs can show kernel and user CPU use separately.  more info
Disk Performance - Graphs the performance of reads and writes to all your local disks as well as network shares.  more info
Network Performance - Graphs the network traffic on your computer. FreeMeter has one network meter. FreeMeter Professional supports two network meters to monitor multiple networks.  more info
Network Total Transferred - The network meter can show total bytes sent and received on the network interface. Can choose between showing the totals since the computer was booted or since FreeMeter Professional launched.
Handle Count - Graphs the total number of open handles. A handle is a token that represents a resource that is being managed by the Windows kernel.  more info
Process Count - Graphs the total number of running processes.  more info
Thread Count - The Thread Count meter graphs the total number of running threads over time.  more info
Physical Memory Use - Two meters, one graphical and one text, that let you keep an eye on your memory use and help you discover if you have enough.  more info
Virtual Memory Use - Two meters, one graphical and one text, that let you keep an eye on your system's virtual memory usage.  more info
Combined Physical and Virtual Memory Use - This meter shows horizontal bar graphs of the current physical and virtual memory use.  more info
Memory Paging - Indicates the rate at which pages are read from or written to disk to resolve hard page faults. This meter is a primary indicator of the kinds of faults that cause system-wide delays.  more info
File Cache - Monitors the amount of memory currently in use by the operating system's file caching.  more info
Running Processes - Get a list of running processes, including how much CPU time and memory they are using.  more info
Network Ping - Ping a list of hosts to determine which are up and how quickly they are responding.  more info
 
 FEATURES
 
FreeMeter FreeMeter
Professional
 
Customize Meter Arrangement - You can move meters up or down in the stack. To do this, right click the meter and select the appropriate menu item.
Customize Meter and Window Size - You can specify the height of each of the graphical meters and the width of the entire window.
Multiple Graph Types - Some graphs can be either bar graphs or line graphs.
System Tray Icons - Display icons in the system tray that show such things as current disk space usage, cpu usage, network traffic, or memory usage.
Customize Meter Colors - Change the colors of all the meters to a predefined scheme or choose your own colors (screen shot). Also control when bar graph lines change color to alert you to heavy use.

3D only
3D or Flat Appearance - Meters can be draw using a 3D or flat drawing style.
Change Meter Text Alignment - Change the alignment of the text under a meter.

small only
Meter Fonts - Text memory meters can be displayed in a small or large font.
Window Transparency - Set two transparency levels, one for when FreeMeter Professional is in the foreground and another for when it is in the background.
Hot Key Activation - Assign a hot key to quickly activate FreeMeter Professional and bring it to the top.

one folder

multiple folders
Folder Usage - Find out how much space is being used by the folders on a disk (screen shot).
Folder Usage Folder Manipulation - Move, copy, delete and hide folders right from the folder usage dialog.
Power Management - Initiate system hibernation mode, stand-by mode, logoff, restart, or shutdown from a FreeMeter system tray icon.
File Logging - Write meter usage information to a text file. (screen shot)
Auto Update - Checks for program updates and can automatically download and install a new version.
 
 DISK SPACE ALERTS
 
These alerts are triggered when the free space on a monitored volume drops below a specified amount.
Click here for a screen shot of the alert preferences.
FreeMeter FreeMeter
Professional
 
Visual - The icon for the drive will change from green to red.
Sound - Play a built-in sound or an external sound file.
Application - Run any application. The application can be passed a number of parameters related to the drive.
EMail - Send an email using an SMTP server. The email can contain information related to the drive.
 
 MEMORY ALERTS
 
These alerts are triggered when the amount of free physical or page file memory drops below a set level for a specified period of time.
Click here for a screen shot of the alert preferences.
FreeMeter FreeMeter
Professional
 
Sound - Play a built-in sound or an external sound file.
Application - Run any application. The application can be passed a number of parameters related to the memory alert.
EMail - Send an email using an SMTP server. The email can contain information related to the memory alert.
 
 CPU ALERTS
 
These alerts are triggered when CPU usage goes above a set rate for a specified period of time.
Click here for a screen shot of the alert preferences.
FreeMeter FreeMeter
Professional
 
Sound - Play a built-in sound or an external sound file.
Application - Run any application. The application can be passed a number of parameters related to the CPU alert.
EMail - Send an email using an SMTP server. The email can contain information related to the CPU alert.
 
 PING ALERTS
 
These alerts are triggered when a server being monitored by the Network Ping meter fails to respond to a ping.
Click here for a screen shot of the alert preferences.
FreeMeter FreeMeter
Professional
 
Sound - Play a built-in sound or an external sound file.
Application - Run any application. The application can be passed a number of parameters related to the down server.
EMail - Send an email using an SMTP server. The email can contain information related to the down server.